Analytics & Revenue Reports
Overview
The Reporting & Analytics section gives you KPI summaries and trend data across your orders, revenue, and product performance. This section will expand over time as new reports are added.
How to Access
Navigate to Reporting Analytics in the left sidebar.
What's Available Now
Landing Page
The landing page shows a list of available reports. Click any report to open it.
By Hour Revenue and Count of Orders Report
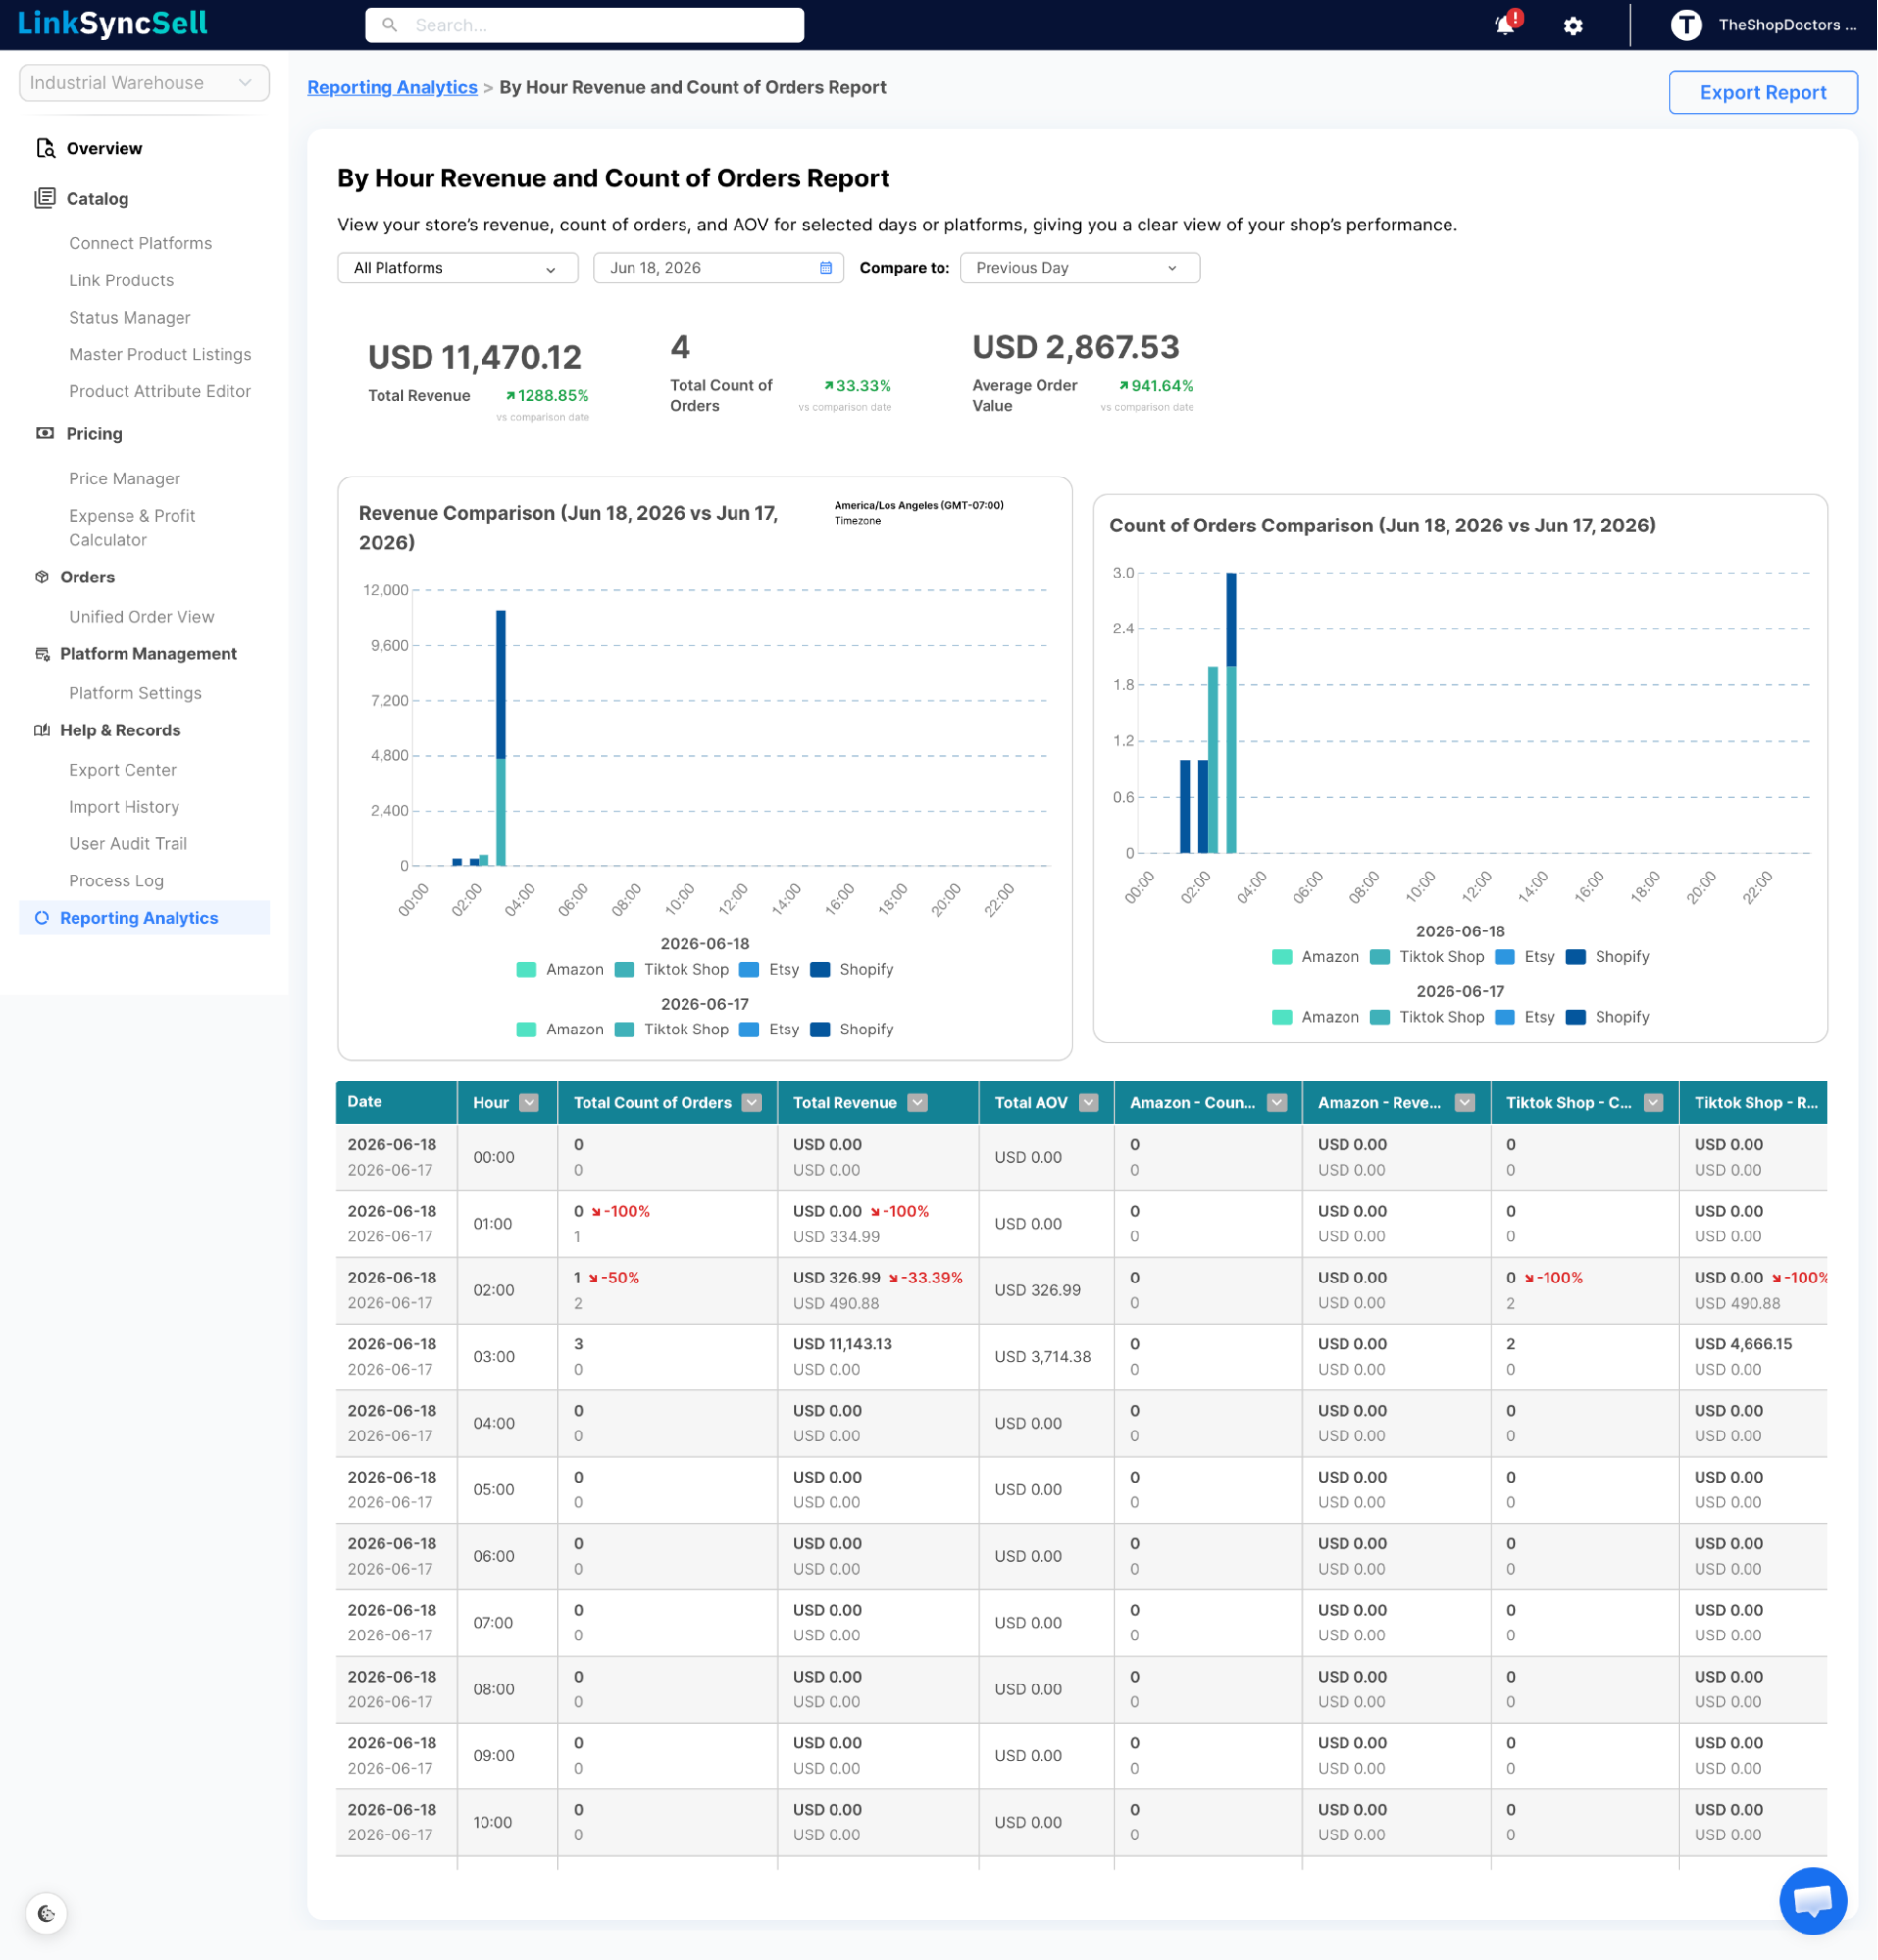
This report breaks down your store's performance hour by hour for a selected date. It's particularly useful for understanding when your orders tend to come in and how revenue is distributed throughout the day.
What you can see:
- Total revenue for the selected date (overall or by platform)
- Count of orders by hour
- Average Order Value (AOV)
- Last 30 days of order revenue and count for context
- Optional comparison to previous day or previous week
Filters:
- Date - select any single date to view
- Platform - view all platforms combined or drill into a specific one
- Compare To - previous day, previous week, or no comparison
Actions:
- Export - download the report data for offline analysis
Tips & Notes
💡
Use the comparison feature to identify day-over-day or week-over-week patterns. If revenue is consistently higher on certain days, you can time promotions and restock operations accordingly.
📝
More reports will be added over time. Check this section regularly for new analytics capabilities.
💡
Hover over any bar in the chart to view detailed metrics for that time period. When a comparison option is enabled, the tooltip shows values for both the selected date and the comparison date, along with the percentage increase or decrease between them.
