Understanding Your Dashboard
Overview
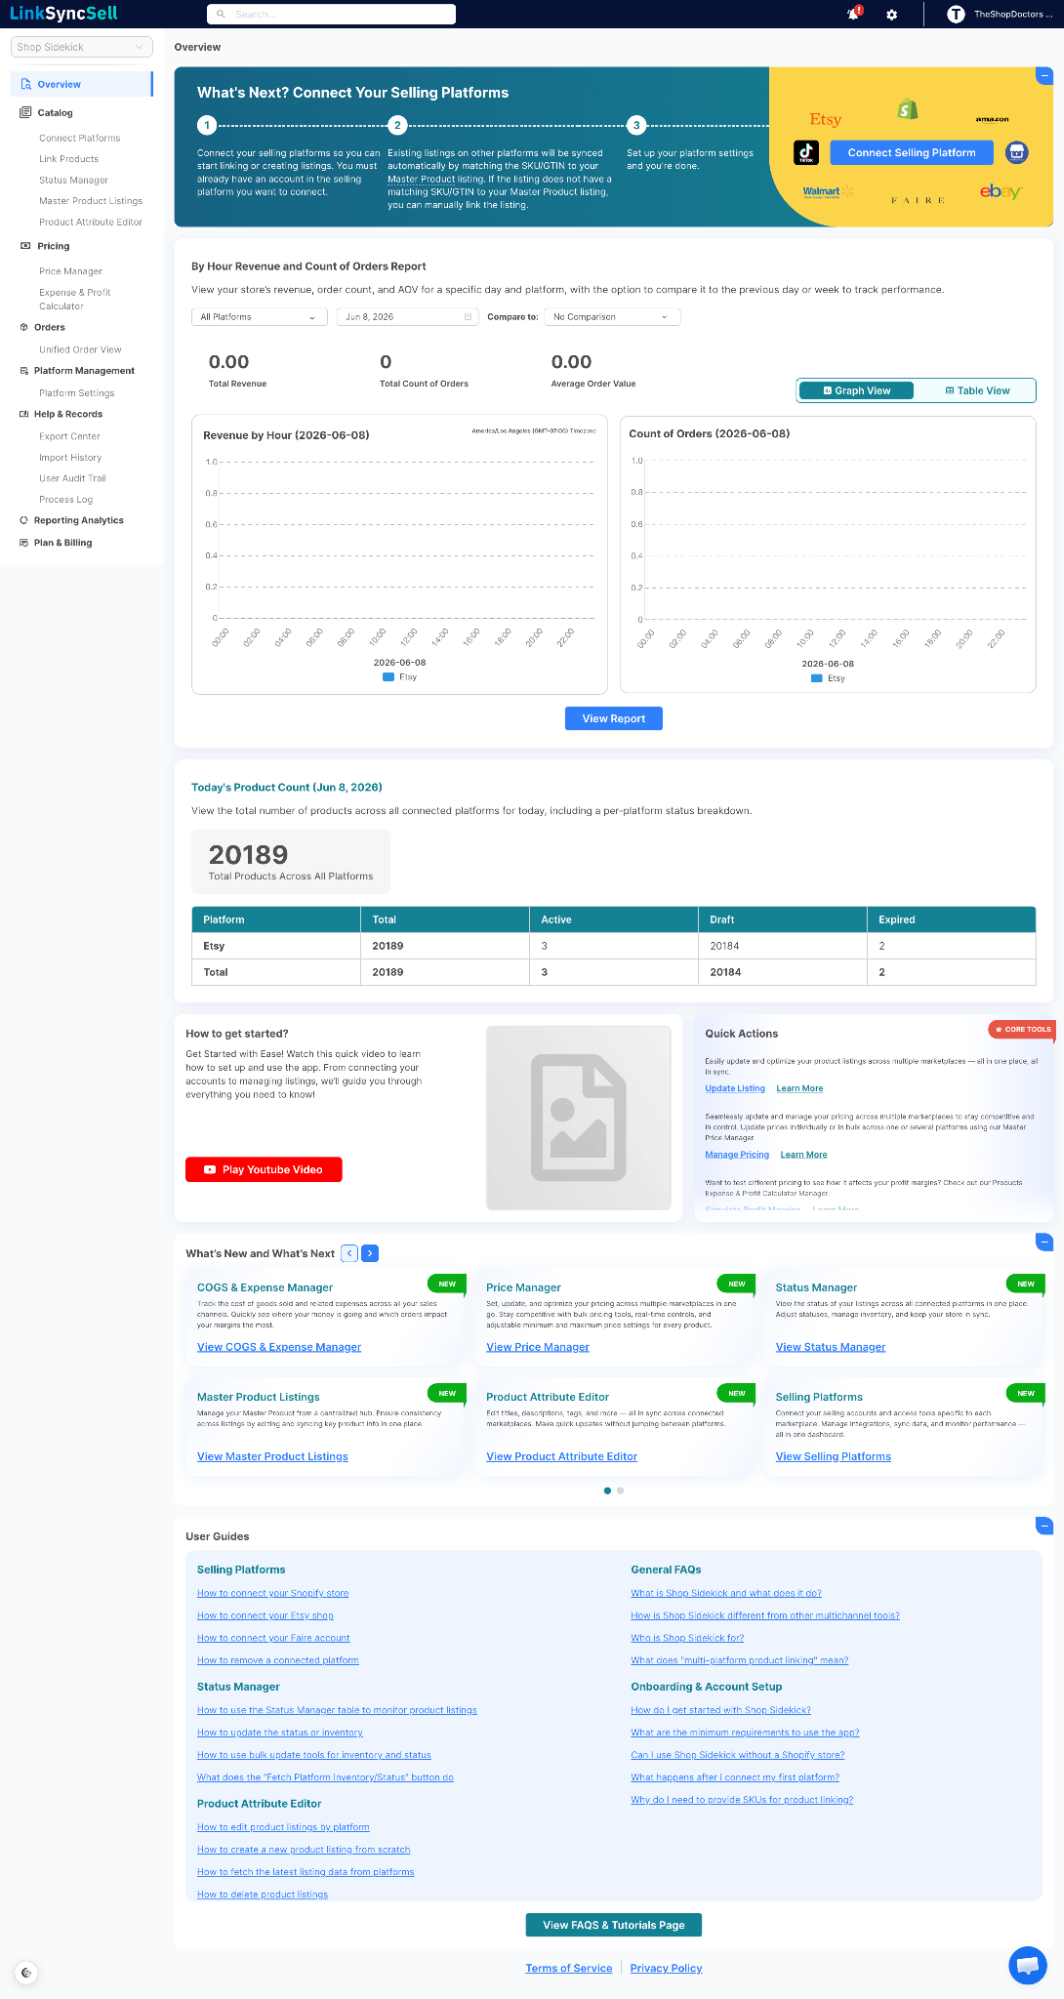
The Overview page is the first thing you see when you log into LinkSyncSell. It's your home base - a single screen that gives you a summary of everything important about your business across all your connected platforms.
Here's what the Overview page is designed to tell you at a glance:
- How your sales are performing today
- How many products you have active across each platform
- Where you need to take action
- Quick shortcuts to the tools you use most
- What's new in LinkSyncSell
Each section of the Overview page is covered below.
The Onboarding Banner
When you first set up your account, you'll see a banner at the top of the Overview page titled something like "What's Next? Connect Your Selling Platforms." This banner is your guided setup checklist.
It walks you through three steps:
- Connect your selling platforms. Click the Connect Selling Platform button (or go to Catalog > Connect Platforms) to authorize your platform accounts.
- Existing listings sync automatically via SKU matching. Once connected, LinkSyncSell imports your products and links them using your SKUs. No extra steps required for most products.
- Set up platform settings and you're done. Head to Platform Management > Platform Settings to enter your platform fees and preferences.
On the right side of the banner, you'll see platform logos for Shopify, Faire, Amazon, and TikTok Shop - a visual reminder of what you can connect.
By Hour Revenue and Count of Orders Report
This widget shows you how your sales are performing throughout the day. It's one of the most useful sections on the Overview page for staying on top of your business.
The three KPI stats at the top:
- Total Revenue - The total sales value for the selected day and platform(s). This is the gross revenue from orders, before fees or expenses.
- Total Count of Orders - The total number of orders received in the selected timeframe.
- Average Order Value (AOV) - Total revenue divided by number of orders. This tells you the average amount customers spend per order.
How to filter the report:
- Platform filter - Click the All Platforms dropdown to narrow the data to one specific platform.
- Date picker - Click the date button to select a different day.
- Compare to dropdown - Choose from No Comparison, Previous Day, or Previous Week to see how today stacks up against recent performance.
Graph view vs Table view:
You can switch between a visual chart and a data table. The graph shows revenue or order counts plotted hour by hour throughout the day. The table shows the same data in rows and columns, which is easier to read for exact numbers.
View Report button:
Click View Report to open the full Reporting Analytics page for this report, where you can dig deeper into your sales data.
Today's Product Count
This section shows you a real-time snapshot of how many products you have across all connected platforms.
At the top, you'll see a single number - your total product count across all platforms combined.
Below that is a breakdown table with one row per platform. The columns are:
| Column | What it means |
|---|---|
| Platform | The selling platform (Shopify, Amazon, etc.) |
| Total | Total products on that platform |
| Active | Live and visible to buyers |
| Active-Sold Out | Live but out of stock |
| Inactive | Deactivated or archived |
| Draft | Created but not yet published |
| Deleted | Removed from the platform |
| Local Draft | Saved in LinkSyncSell but not yet pushed to the platform |
Use this table to spot issues at a glance - for example, if you notice a high number of Inactive listings on a platform when you expected them to be Active.
Quick Actions
The Quick Actions section has three shortcut cards that link directly to the tools you'll use most often:
- Update Listing - Takes you to the Product Attribute Editor. Use this to quickly edit a product's details and push the update to your platforms. (All Inclusive plan)
- Manage Pricing - Takes you to Master Products, where you can review and manage pricing across your catalog.
- Simulate Profit Margins - Takes you to the Expense & Profit Calculator. Use this to model costs and see your real margins. (All Inclusive plan)
What's New and What's Next
This section is a carousel of feature announcements and tips from the LinkSyncSell team. It keeps you up to date on new features, upcoming changes, and helpful suggestions.
To navigate between cards, click the left and right arrows on either side of the carousel, or use the dot indicators below the card to jump to a specific one.
User Guides Section
At the bottom of the Overview page, you'll find a User Guides section with quick links to common help articles organized by category. This is a shortcut to the same guides available under Help & Records > User Guides - handy when you need help without leaving the dashboard.
Tips & Notes
Troubleshooting
The dashboard shows no data at all.
This usually means no platforms are connected yet, or the initial sync hasn't completed. Go to Catalog > Connect Platforms and make sure at least one platform is connected. Then check the Process Log (Help & Records > Process Log) to see if an import is still running.
Revenue shows $0 even though I've had orders today.
Orders sync every 15 to 30 minutes. If you've had recent orders, wait a few minutes and refresh the page. Also check that the platform filter is set to "All Platforms" and the date is set to today. If orders still don't appear, check the Process Log for sync errors.
The product count doesn't match what I see on my platform.
Counts update when a sync runs. If you recently added or changed products on a platform, the count in LinkSyncSell may not reflect that yet. Trigger a manual sync from Platform Management > Platform Settings and refresh the Overview page.
